Analyzing Spotify
What makes a song popular, and how much can the data actually tell us?
An exploratory analytics project examining more than 230,000 Spotify tracks to understand how audio characteristics relate to popularity and how those patterns change across genres.
TL;DR
I analyzed more than 230,000 Spotify tracks across 26 genres to explore how nine audio features relate to popularity. The goal was not to find a formula for a hit song. It was to understand which patterns appeared in the data, how those patterns changed by genre, and where the dataset stopped being able to explain listener behavior.
Popularity is visible. The reasons behind it are harder to isolate.
I began with a broad question: which measurable characteristics appeared alongside track popularity, and how much could those relationships actually explain? The dataset made popularity visible, but it did not automatically explain why listeners chose one song over another.
I used three questions to guide the analysis. Which audio features were associated with popularity? Did those relationships remain consistent across genres? What important cultural, promotional, and behavioral factors were missing from the data?
230,000 tracks across 26 genres
The dataset contained more than 230,000 tracks across 26 genres. I examined nine audio features: loudness, acousticness, danceability, energy, instrumentalness, liveness, speechiness, tempo, and valence.
Track popularity served as the outcome for the analysis, but it was never treated as something the audio attributes determined on their own. Popularity is influenced by the music, the artist, distribution, promotion, timing, culture, and listener behavior.
Before finding patterns, the data had to be usable.
Before looking for relationships, I used Excel to clean and organize the dataset so the variables could be compared consistently. That meant checking fields, structuring the analysis, and making sure the charts were built from usable records rather than treating every row as equally reliable.
I then used Tableau to explore patterns at scale. The process moved from preparation to relationship analysis, visualization, comparison, and interpretation. Each step mattered because a polished chart can still be misleading when the underlying variable or question is poorly defined.
Analysis visual
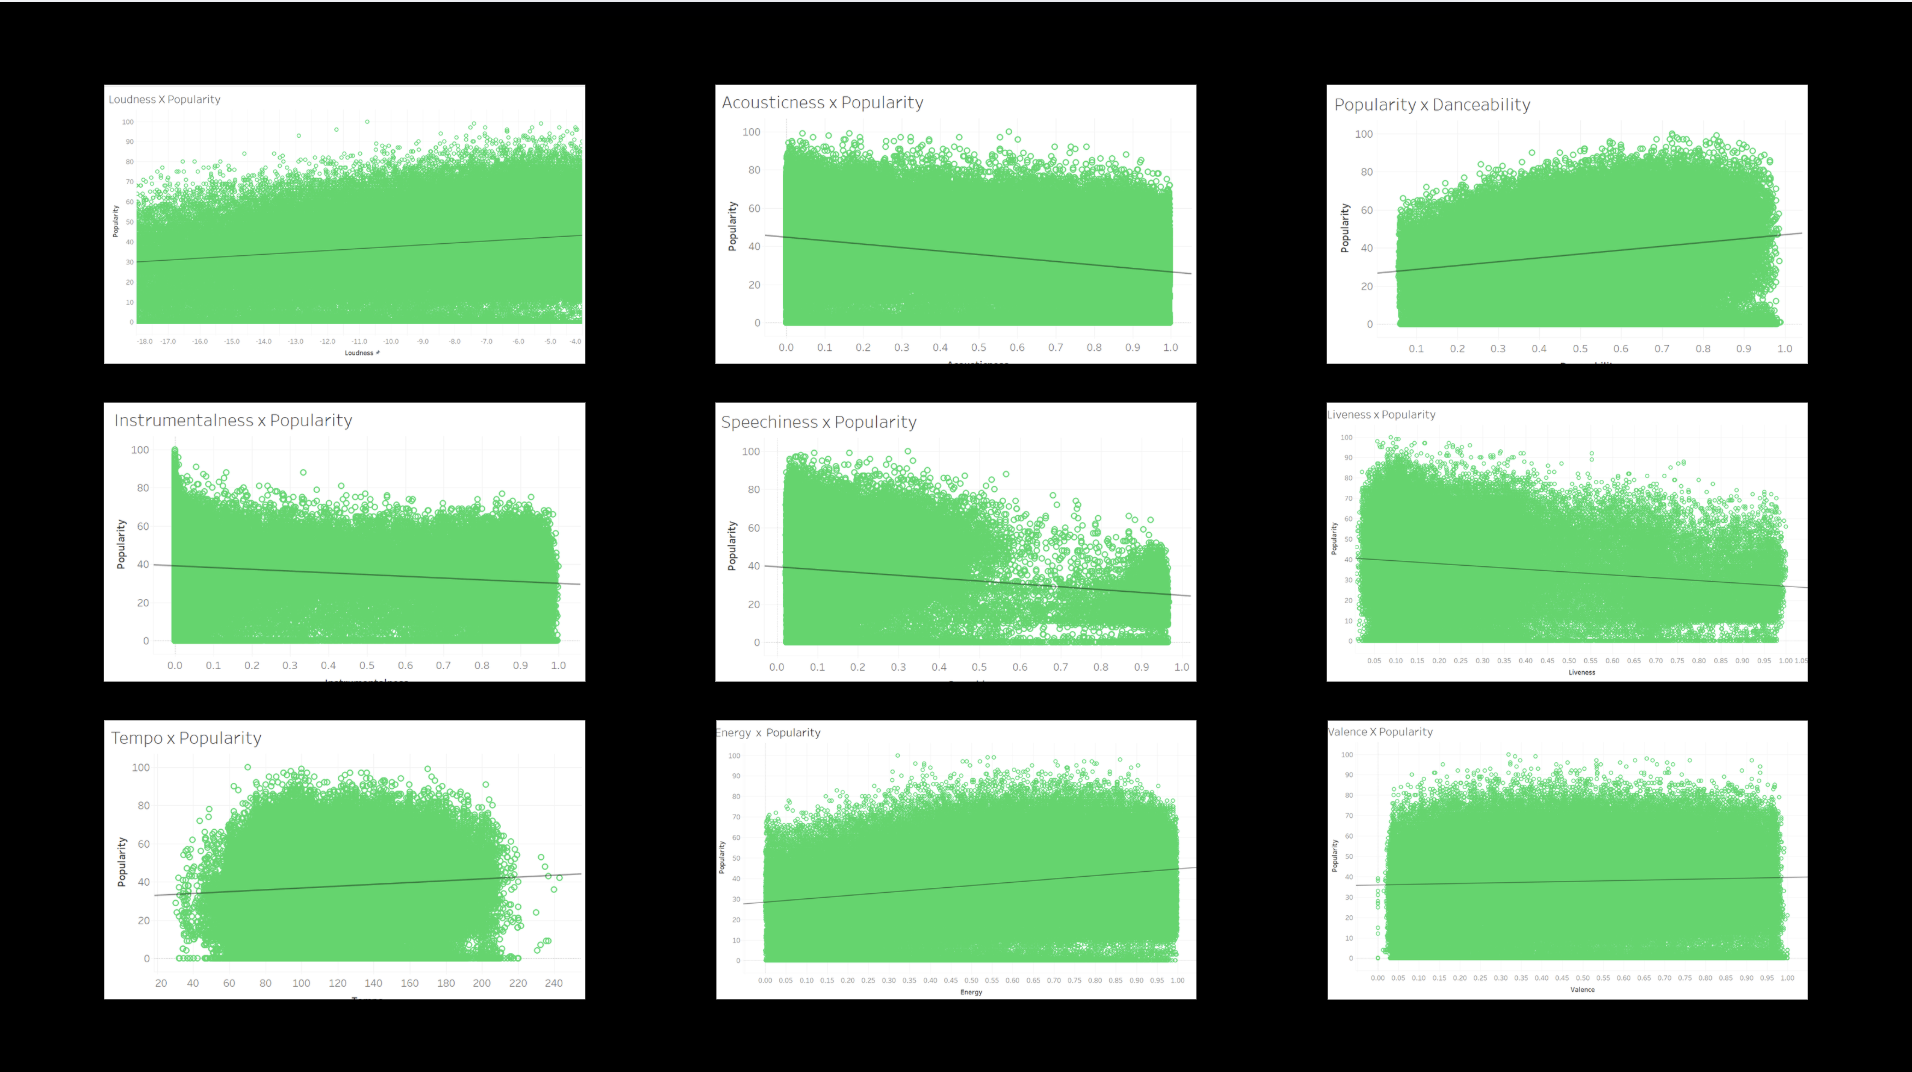
The Tableau visual summarizes how nine Spotify audio features relate to popularity across the full dataset. It supports the written analysis without turning the case study back into a chart-heavy report.
Some audio features moved with popularity. Others moved against it.
Across the full dataset, loudness, danceability, energy, and valence moved positively with popularity. Acousticness, instrumentalness, tempo, liveness, and speechiness moved in the opposite direction.
These relationships were descriptive, not causal. A louder or more danceable song is not automatically popular because of that characteristic, and changing one feature would not guarantee a different commercial outcome.
The overall dataset was only the first layer.
Looking at every genre together created one average story about a highly varied catalog. That made the analysis easier to summarize, but it risked hiding relationships that behaved differently within individual musical contexts.
I segmented the analysis to compare Pop, Hip-Hop, Indie, and Rock before choosing Hip-Hop for a deeper look. The purpose was not to rank genres. It was to test whether the platform-wide pattern remained stable after narrowing the context.
The relationships changed when we narrowed the context.
Within Hip-Hop, danceability and loudness showed positive relationships with popularity. Liveness, energy, and speechiness moved negatively, while acousticness, duration, tempo, and valence did not show a clear relationship.
That pattern differed from the overall dataset. The difference reinforced that one universal set of audio characteristics would oversimplify how popularity behaves across musical categories.
Audio characteristics are only part of why music becomes popular.
The dataset could describe sound characteristics, but it could not explain the full system around a song. It did not include playlist placement, artist following, marketing spend, release timing, social media momentum, radio exposure, collaborations, cultural moments, or repeat listening behavior.
That missing context matters. A track can become popular because of distribution, community, timing, or platform dynamics, not only because of its measurable audio features.
The analysis is more useful for asking better product questions than declaring a formula for a hit song.
The findings are most useful as a starting point for product and analytics questions. If certain features relate differently to popularity by genre, a music platform should be careful about using one generic recommendation or promotion logic across all categories.
The stronger product question is not “What makes a song popular?” It is “Which signals matter for this listener, this genre, and this context?”
The next analysis should add listener behavior, not just more audio features.
If I continued the project, I would add listener behavior signals such as saves, skips, playlist adds, repeat listens, completion rate, and sharing. I would also compare trends over time so popularity could be interpreted as a changing outcome rather than a fixed score.
Those additions would move the analysis closer to how people actually discover and return to music. Audio features can describe the song, but behavior signals can better explain the relationship between the song and its audience.
The biggest dataset does not automatically produce the clearest answer.
This project taught me that a large dataset can still answer only a narrow version of the question. The analysis made visible patterns easier to discuss, but it also made the missing context more obvious.
The strongest conclusion was not a formula for popularity. It was a reminder that analytics should clarify what the data can support, what it cannot support, and what additional evidence would be needed before making product decisions.
OrgFlow
Building the operating layer for student organizations.
VIEW PROJECT →